Did you miss our final webinar before the summer – Anywhere Services Live? Don’t worry, you can learn everything that you missed right here in this blog post or you can watch the recorded version on demand here:
http://analyticalanswersinc.com/anywhere-services-live/
This May webinar was a bit different from our traditional webinar format. Analytical Answers recently celebrated our 25th anniversary of providing microscopy, spectroscopy and other materials analysis services. In honor of this, Joseph Bedard, Senior Failure Analysis Scientist; Jay Powell, Senior FTIR Spectroscopist; and Edward Norton, Technical Director at Analytical Answers presented this session on one of the unique services the company offers. This webinar focused on our Anywhere Services, which allows you to send in your samples regardless of where you are, and have our team of professionals analyze them with your participation. This service can be partially or entirely live, depending on the needs of the client.
Ed Norton, Technical Director, started off the presentation by introducing the Analytical Answers Anywhere Service, which Analytical Answers has been providing to clients for over a decade. By participating with the scientists as they are performing an analysis, clients can ask questions and see certain parts of the process in greater detail. As an added bonus, clients can bring in colleagues and vendors of their choice at their convenience so that they can see the analysis in real time and work in collaboration.
The sample that was analyzed in this webinar was chosen from client submissions. It was a circuit board from a medical device that failed Highly Accelerated Life Testing (HALT). This is a testing procedure that combines temperature cycling with high humidity, while putting the sample under stress (powering it up) to see how prone it is to failure. Viewing the sample circuit, soot and burned components were clearly visible as well as various residues. Sites on the back side of the board also showed evidence of contamination and possible corrosion as well as a burned area of a component.
Joe Bedard examined areas of suspected corrosion using Scanning Electron Microscopy (SEM) with Energy Dispersive X-ray Spectroscopy (EDS) to identify the elemental composition of those areas. Joe used a very helpful feature of the instruments he was using, which is the ability to take an optical image of the sample and, using optical and SEM imaging, quickly perform a 3-point stage registration. This correlative approach allows one to navigate to any part of the sample in the SEM by double-clicking on a point of interest on the saved optical image.
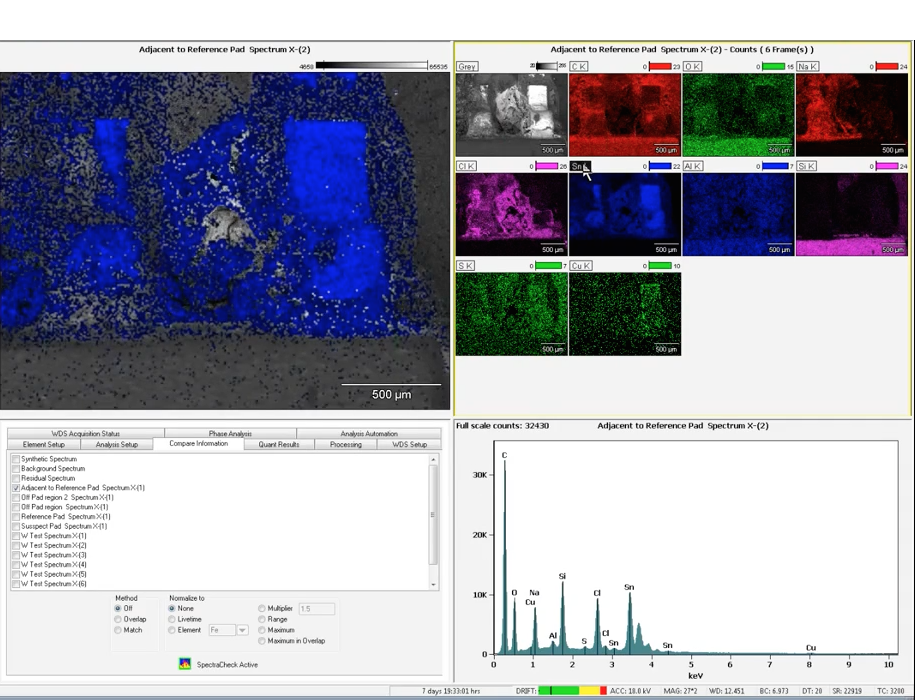
Next, Joe focused his analysis on several small areas that appear to have been particularly damaged, one possibly forming a bridge between device leads. He also analyzed lead itself and some material that could be a flux residue near the lead. He collected secondary and backscattered electron images (which show surface topography and atomic number contrast, respectively) as appropriate to minimize charging artifacts in the images, and X-ray spectra from each region. One of the EDS spectra in particular showed a significant amount of chlorine, which may indicate there was a corrosive species present during the HALT process. Chlorine was also detected in other parts of the damaged board, but was not found on the reference lot board while analyzing a similar area.
Joe then collected a quick EDS elemental map of the analyzed region to understand the distribution of the elements detected in the previous analyses. This is a key piece of information in understanding whether this particular material created a bridge between adjacent contacts causing a short circuit. By collecting the elemental map, Joe was able to determine that tin was indeed forming a bridge between two contacts on this device, and was probably the cause of the unit failure during the HALT process. The chlorine component is the likely cause of the observed corrosion.
Jay Powell, Senior FTIR Spectroscopist, then took over the analysis, using Fourier Transform Infrared Spectroscopy (FTIR) to examine the organic compounds that may be present (as indicated by the large amounts of carbon [C] detected by EDS). He commented that, while EDS detected carbon and oxygen on a certain component, that technique does not show chemical composition – which is where FTIR comes into the process. Using a portion of the board that was not used for SEM work, he collected a small amount of the glossy material from the surface of the failed part for his analysis. He also took a sample of flux from the “control” board for comparison. Since the FTIR microscope can target a small area of a sample for analysis, a large specimen is generally not needed and a small sample is often either physically removed or solvent-extracted from a larger part.
By comparing the sample from the failed board to that from the reference board under similar background conditions, it was clear that not all components were the same. This led to the conclusion that what appeared to be flux on the failed board was not the same flux material collected from the reference board.
Through the use of complementary analytical techniques such as SEM/EDS and FTIR, it showed that there were significant differences in the flux from the failed board, compared to the reference board. The presence of an incorrect flux with the presence of chlorine, likely resulted in the corrosion and eventual short circuit of the board.
And with the Anywhere Services by Analytical Answers, clients and vendors can take part in this intricate analysis process to gain a better understanding of both the analytical process and the practical information they gain through detailed analysis – without having to be present in the laboratory.
