Complex Mixtures for Complex Tastes
The demand for ‘pure and natural’ flavorings is often met through the use of concentrated extracts, typically in an ethanol (ethyl alcohol) base. Such extracts, while giving the appearance of a single flavor component, such as lemon or mint, are actually complex mixtures of many different complex organic compounds.
Complex Mixtures for Complex Tastes
Summary
The demand for ‘pure and natural’ flavorings is often met through the use of concentrated extracts, typically in an ethanol (ethyl alcohol) base. Such extracts, while giving the appearance of a single flavor component such as lemon or mint, are actually complex mixtures of many different complex organic compounds. Separating complex mixtures into individual components for identification and quantitation has led to the development of hyphenated analytical techniques. Here, Gas Chromatography (GC) coupled to a Fourier Transform Infrared (FTIR) spectrometer with subsequent Flame Ionization Detection (FID) produces both qualitative identification and quantitative measurement of complex mixtures.
Introduction
From the morning coffee and scone to the last fork of dessert after dinner, our meals and snacks are filled with a rich variety of flavors from our foods. While the human taste buds can discern five general groups of flavors (salt, sweet, bitter, sour, and savory), our perception of the distinct flavors of each bite arises from the aromatic (or volatile) compounds present.
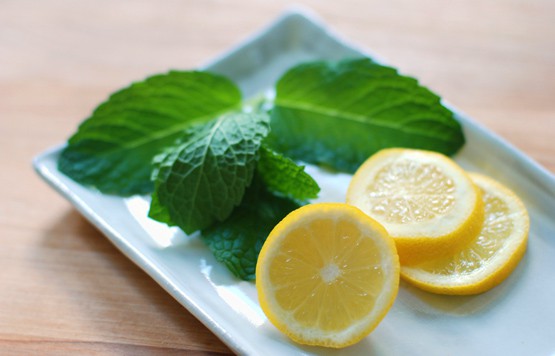
These compounds are generated by a combination of the original food and spice components used in the recipe, coupled with the changes induced by different cooking techniques. Oftentimes a combination of demand for a particular flavor, practicality in handling, convenience, and other considerations from both the home cook to the industrial food and beverage manufacturer requires the use of flavoring extracts to generate the desired taste component. Such extracts are typically created using ethanol, or ethyl alcohol, to extract flavorful components from the natural source, such as lemons or mint leaves. These extracts are then further filtered and blended to create a consistent and stable product. Such extracts, while having one major flavor, are typically composed of many different compounds which each add an individual ‘note’ to the overall composition.
Identification of the individual compounds in complex mixtures presents a challenge to the analytical chemist. Using routine spectroscopic techniques alone, such as FTIR, an experienced chemist may be able to factor out 3-4 major compounds from a spectrum of the bulk liquid and dried residue. However, the flavors and fragrances of even simple extracts are composed of many more compounds than can be discerned from a single bulk spectrum. To better identify and quantify the individual components, a combination of the separation technique of gas chromatography coupled with identification technique of infrared spectroscopy results in the hyphenated technique of Gas Chromatography – Fourier Transform Infrared Spectroscopy, abbreviated GC-FTIR.
The Technique
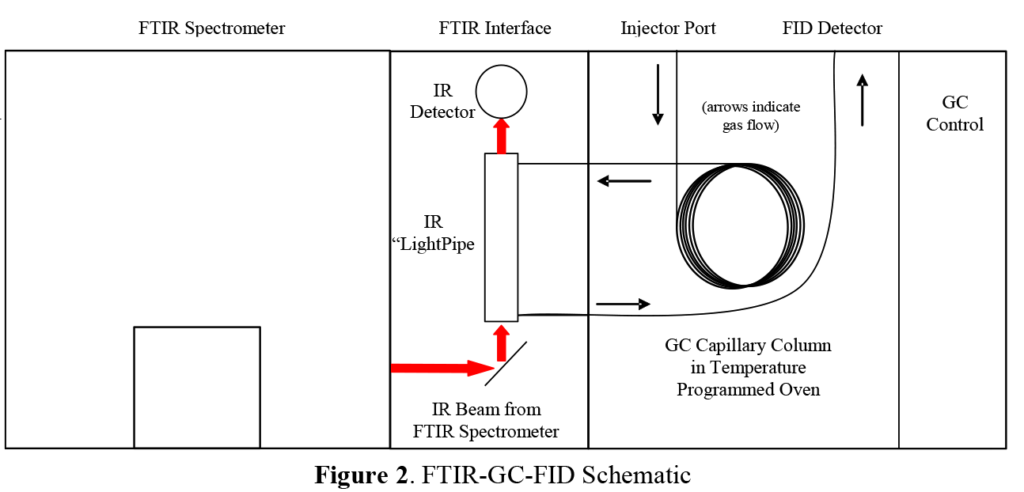
See the instrument diagram in Figure 2. A Gas Chromatograph (GC) consists of a long, fused silica capillary tube held in a temperature controlled and programmable oven. An inert gas (usually helium) flows through the column, sweeping compounds injected through the column and out to the detector. The inside walls of the capillary column are coated with an inert and heavily cross-linked material called the stationary phase. Different compounds have different degrees of interaction with the stationary phase and thus, are swept through the column at different rates. The degree of interaction can be modified by increasing or decreasing the oven temperature. The oven temperature is generally maintained at a point just above the boiling point of the sample solvent. After a short time allowing the solvent to be separated from the heavier components of the sample (ca. 2-4 min), the oven temperature is gradually increased.
Compounds with low interactions with the stationary phase are swept out of the column first, followed by heavier compounds and compounds with more interactions with the stationary phase. Separated compounds are then swept into a detector such as the Flame Ionization Detector (FID) that generates an intensity trace as a function of time, which is called a chromatogram.
AAI’s FTIR spectrometer uses a light pipe interface to the GC. This interface consists of a pair of heated transfer lines and a heated, internally gold-coated, quartz capillary tube with infrared windows at each end. As individual compounds elute from the GC, they pass through the light pipe. Compounds in the light pipe absorb infrared light from the FTIR and produce a continuous series of infrared absorbance spectra as a function of time. FTIR software is then used to select, signal average, and apply background and other corrections, generating final infrared spectra for the peaks from the GC. These processed peaks can be then identified by comparison to AAI’s reference libraries of 220,000+ compounds and commercial formulations.
The Analysis
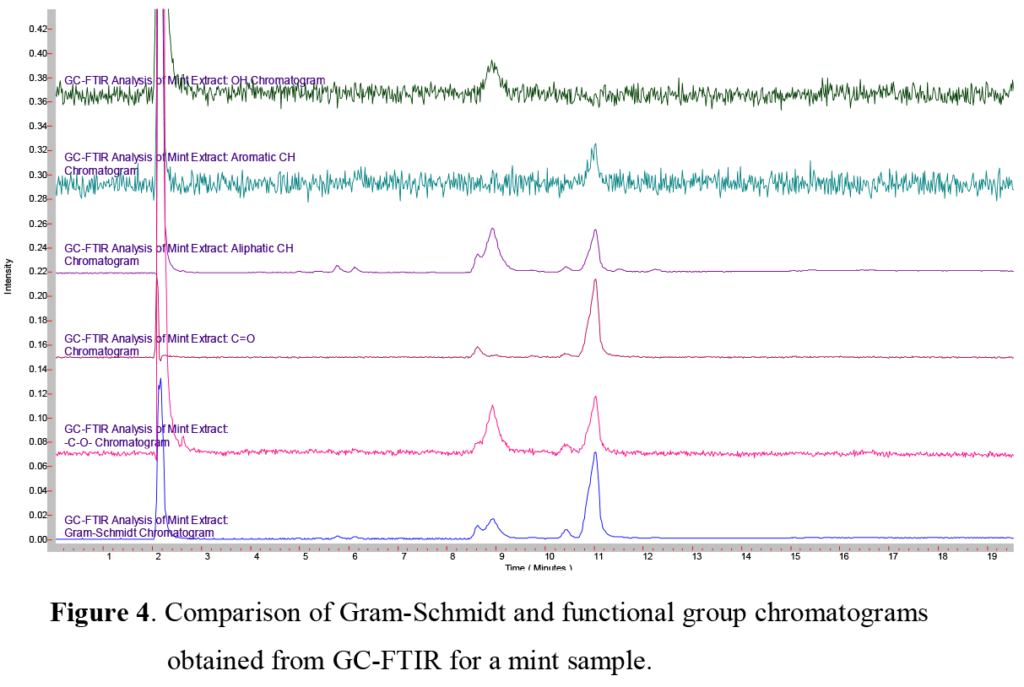
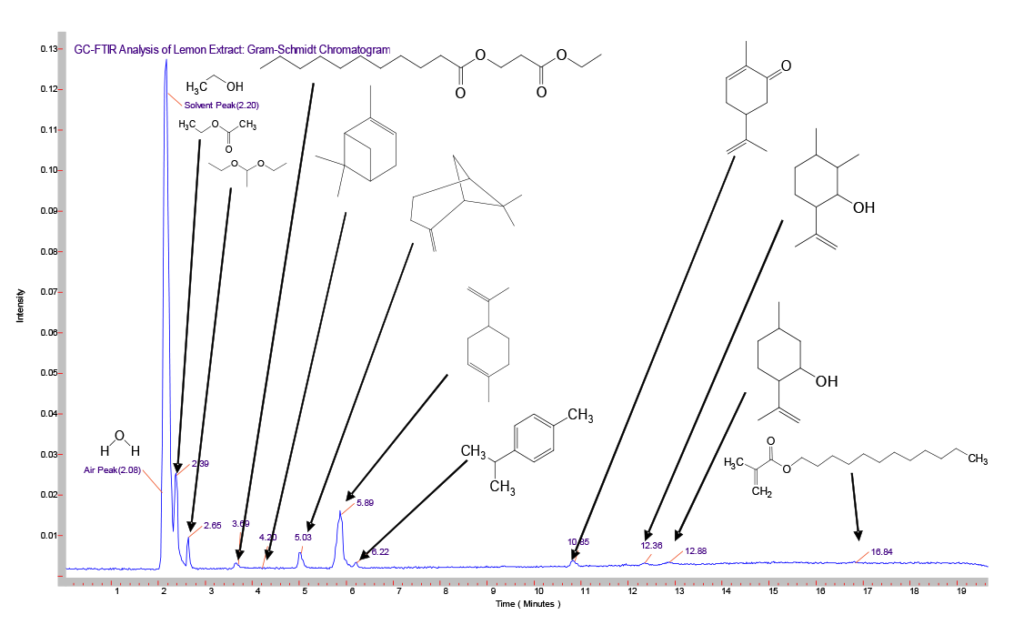
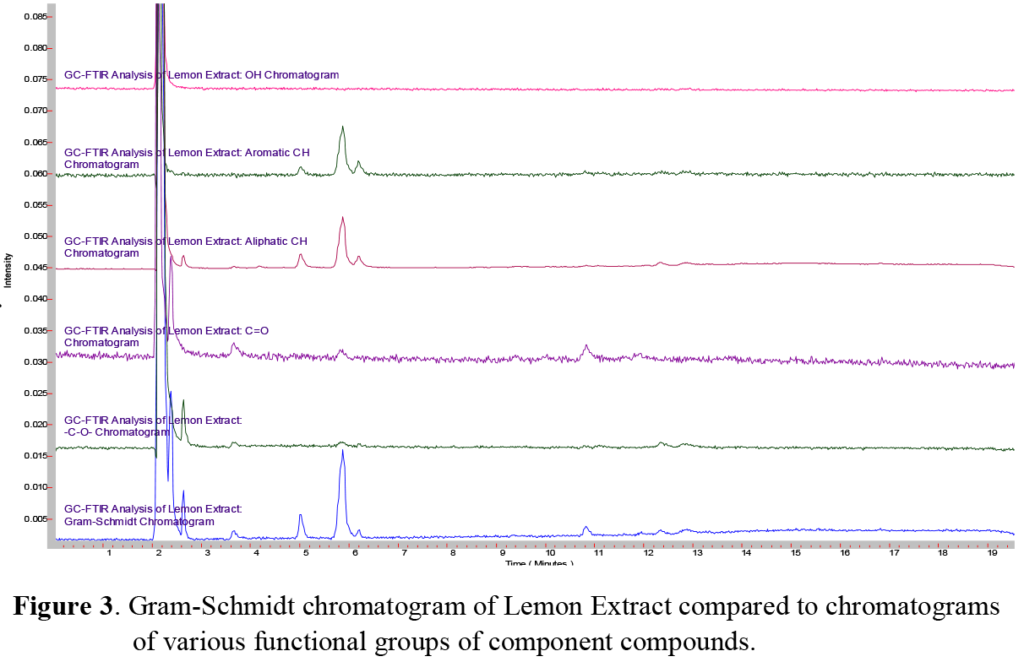
Here we examined two different natural ethyl alcohol extracts, comparing the sharp and bright flavor of a lemon extract to the aromatic and cooling flavor of a mint extract. Since the composition of each of these were listed ~80% ethanol, the same GC column, injection technique, and temperature program was used for each. Using the GC/FTIR interface, continuous real-time full spectral data are collected every second, allowing monitoring and inspection of infrared absorbing species. These sequences of real-time chromatograms, can be based on either a general/overall infrared absorbance known as a Gram-Schmidt chromatogram, or absorbance based on a specific frequency window known as a Functional Group chromatogram, as shown in Figure 4. In a comparison of the Gram-Schmidt (GS) and Functional Group (FG) chromatograms for the lemon and mint extracts presented here, we can see not only how the individual functional group chromatograms start to show the different species present, but also how the different extracts show different overall profiles.
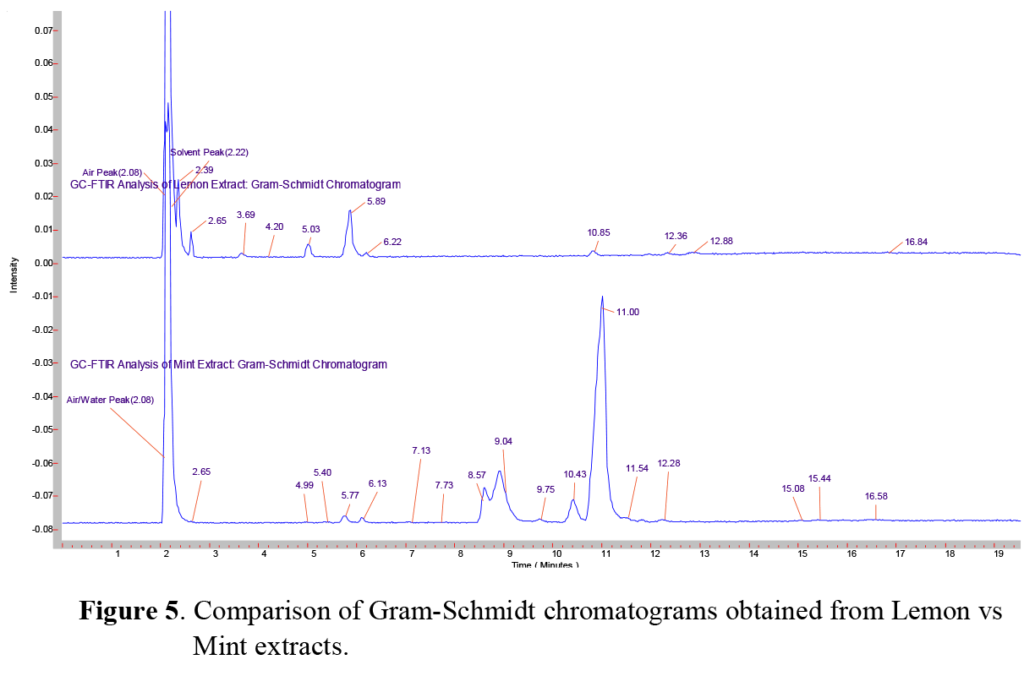
Once the GC run is complete, the scientist can retrieve the complete data set and select individual peaks from the Gram-Schmidt and Functional Group chromato-grams for further spectral processing and analysis. A comparison of the GS chromatograms of the lemon (top) and mint (bottom) extracts shown in Figure 5 reveals that a large number of major, minor and trace component peaks can be quickly found and selected for further analysis. Although we will not attempt to identify and each and every GC peak, we will present a few selected components for illustration.
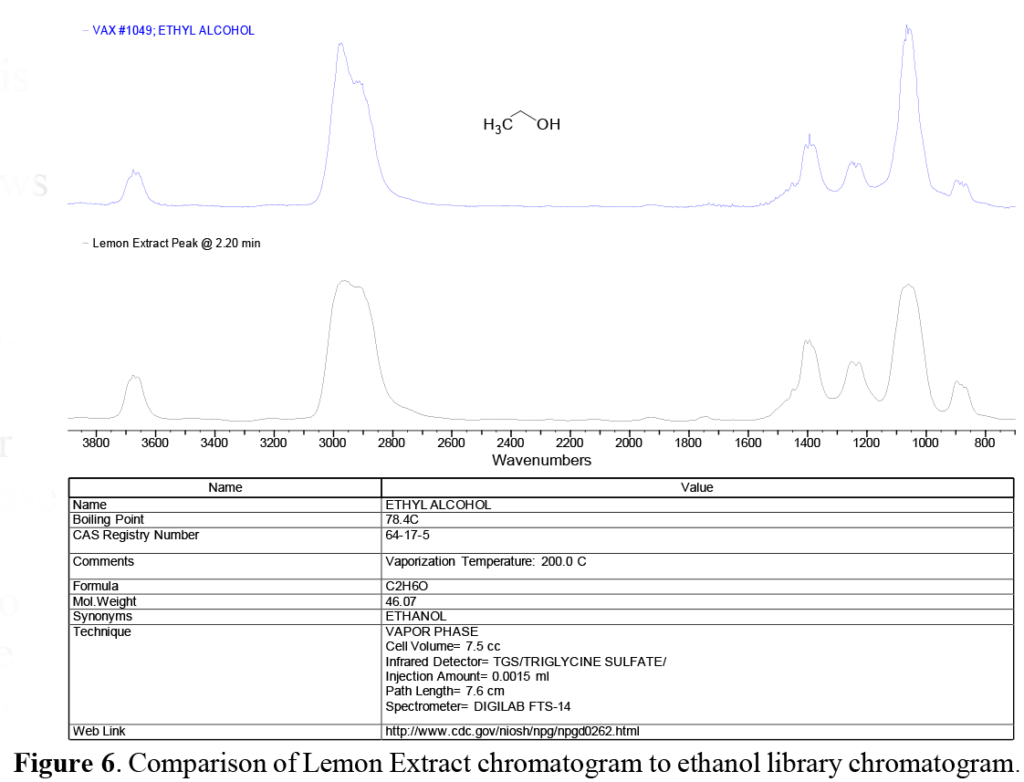
In the chromatograms shown in Figure 5 above, we note the large solvent peak at ~2.2 minutes in both samples. Since the bottle labeling indicates that both are ~80% ethanol, we expect this major peak to be ethanol. Comparing the peak at this retention time (RT) to AAI’s reference libraries in Figure 6 shows a very good match with the vapor phase chromatogram of ethanol. While not surprising, this comparison illustrates the importance of selecting the appropriate library or set of libraries, since the vapor phase spectra of most compounds will appear different when compared to the condensed phase spectra of the same compound. This is similar to, but not as severe as, the problems encountered using GC/MS (Gas Chromatography/Mass Spectroscopy), where electron impact MS fragmentation patterns are significantly different than the MS fragmentation patterns produced by chemical ionization.
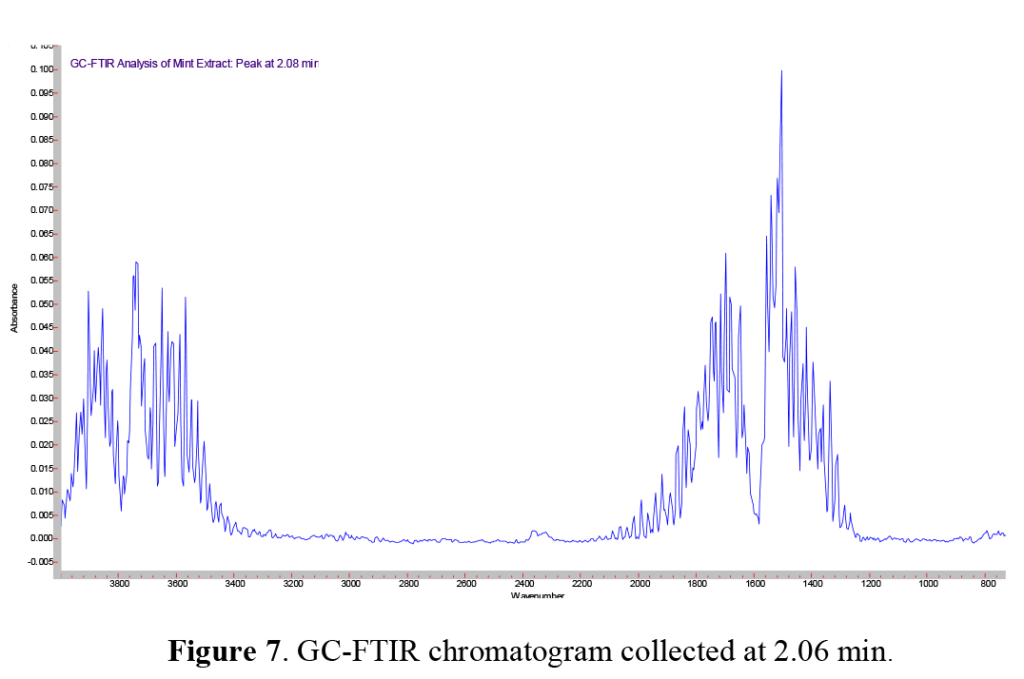
Just before the main solvent peak, we note a minor peak in the GS chromatogram at ~2.1 minutes. Interestingly, this peak is not seen on the FID trace. As described above, the FID chromatogram is produced by the individual eluants from the GC column passing through an H2 / air flame. When these components are ‘burnt’ in the flame, they produce a change in the gas conductivity, which is amplified and recorded as an FID trace. This minor peak eluting just before ethanol and shown in the spectrum above, is immediately recognized as water, exhibiting the distinct ‘hash’ of water vapor rotational lines in the gas phase. This also illustrates an important consideration when comparing sensitivity of various techniques: compounds which generate a strong infrared response (such as water) may generate a weak (in MS) to nonexistent (in FID) response by other techniques.
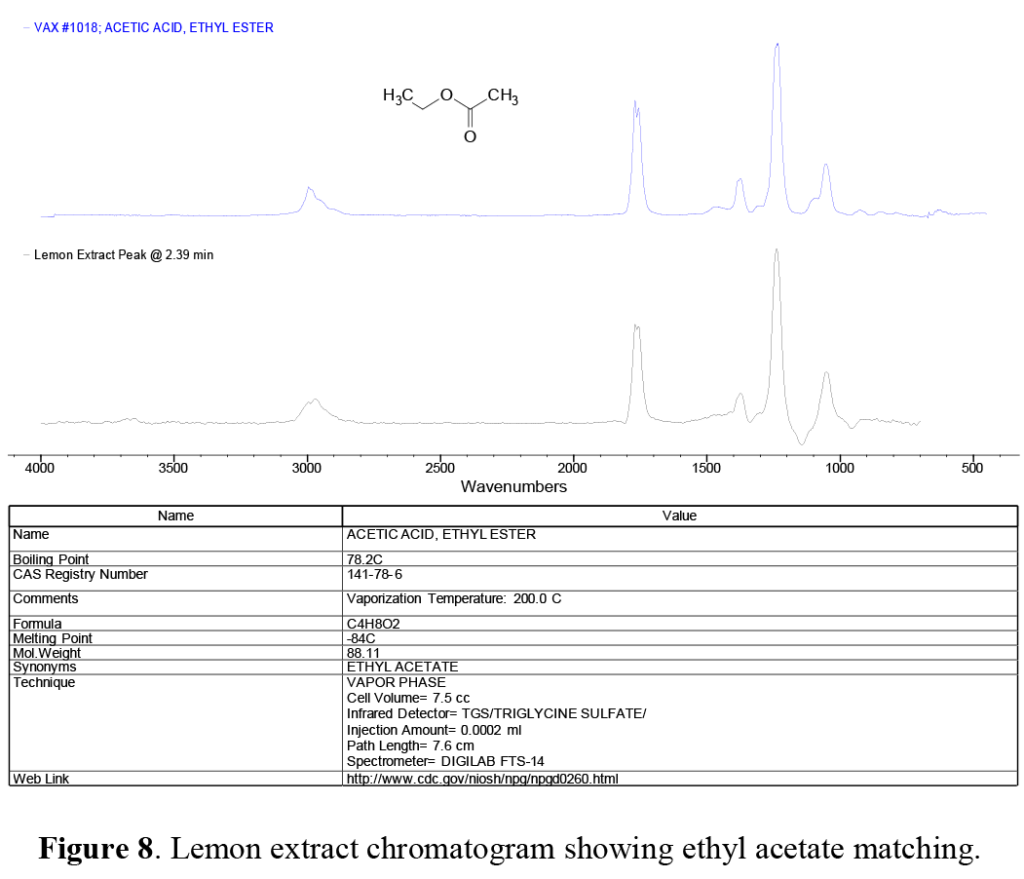
In the lemon extract, just on the tail edge of the ethanol solvent peak, we note a peak at 2.39 minutes not seen in the mint extract. This peak was identified as ethyl acetate, the ester of ethanol and acetic acid, and is one of the characteristic compounds that give pears their distinct aroma. In the comparison chromatogram of this peak from the lemon extract (Figure 8), note the dip below the baseline at around 1250 cm-1. This is due to the co-eluting ethanol solvent ‘tail’ spectral contributions, which have been removed by spectral subtraction. This illustrates another advantage of GC-FTIR over GC/MS: spectral handling and interpretation techniques used in infrared are difficult – or even nonexistent in MS.
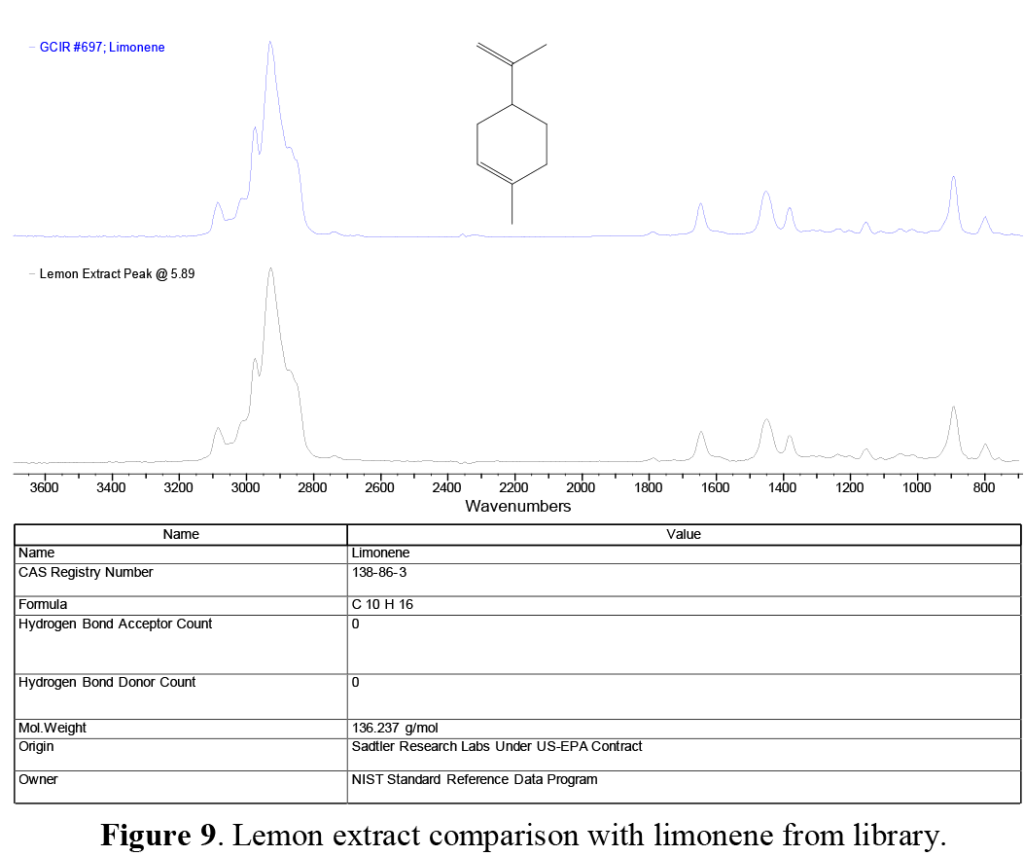
At ~5.8 minutes in both traces (Figure 5), we note a distinct GC peak appearing as a relatively major component in the lemon extract, and a minor but still significant component in the mint extract. This compound is identified as limonene (Figure 9). As its name suggests, it is one of the major compounds that gives lemons and other citrus fruits their characteristic ‘nose’. Limonene and similar compounds based on the molecular structure shown are known as cyclic terpenes, and are used in products ranging from air fresheners to ‘green’ cleaning products due to their ability to dissolve hydrophobic greases and oils.
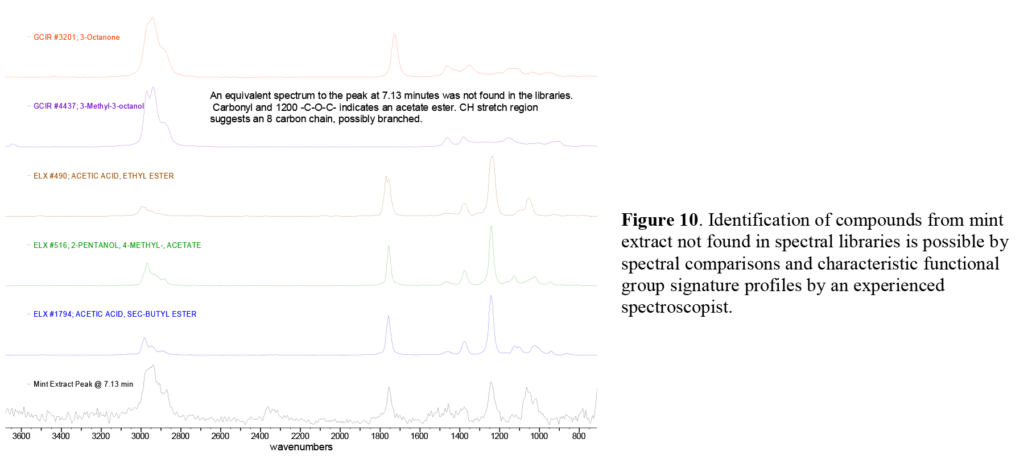
In the mint extract at 7.13 minutes, we note a minor GC peak, which has no matching infrared spectrum in the libraries. In spite of this, we are able to identify this as ethyl-5-methyldecanoate (Figure 10). Fortunately the infrared absorbance of different functional groups generate similar infrared spectra, which an experienced spectroscopist can combine with other characteristic functional group signature profiles for a more detailed, if tentative, identification. As always, positive identification requires comparison to the infrared spectrum of a reference compound.
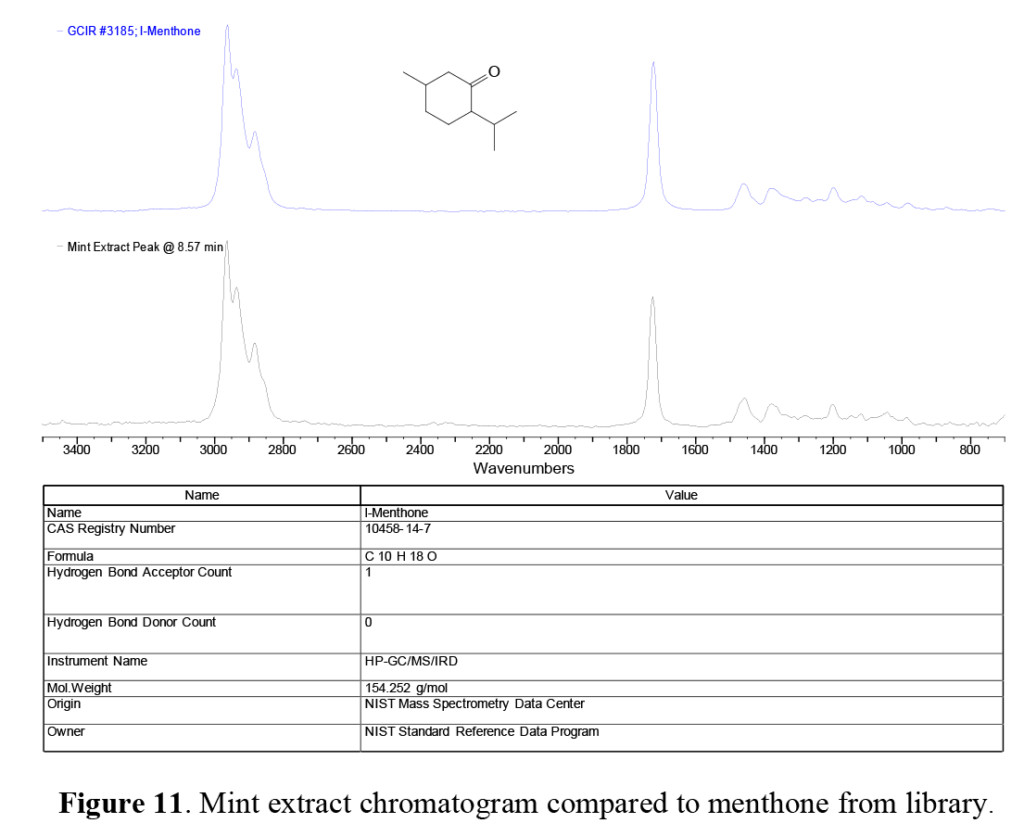
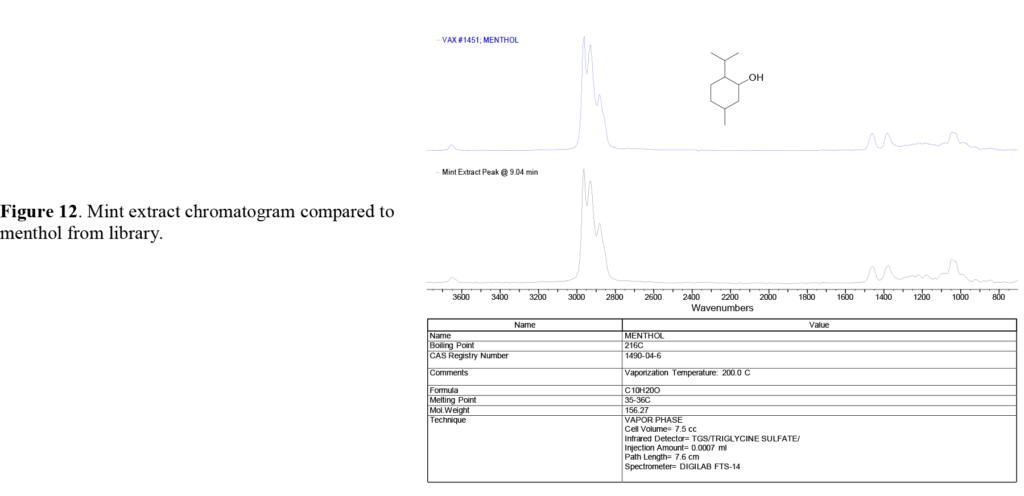
A pair of overlapping peaks at ~8.6 and ~9.0 minutes are seen in the mint extract GS trace. These peaks, which appear to be relatively minor components, are actually menthone and menthol, a cyclic ketone (menthone) and cyclic alcohol (menthol), both based on a molecular structure similar to limonene, and are responsible for the ‘nose’ and cooling taste of spearmint, peppermint, and other members of the mint family.
Overall, the GC-FTIR technique is very effective at ‘breaking down’ complex mixtures into individual components by the GC, which can be identified by the power of FTIR spectroscopy. Figures 14 and 15 summarize the structures found in each GC-FTIR trace for the lemon and mint extracts. The compounds are listed by name in Table 1.
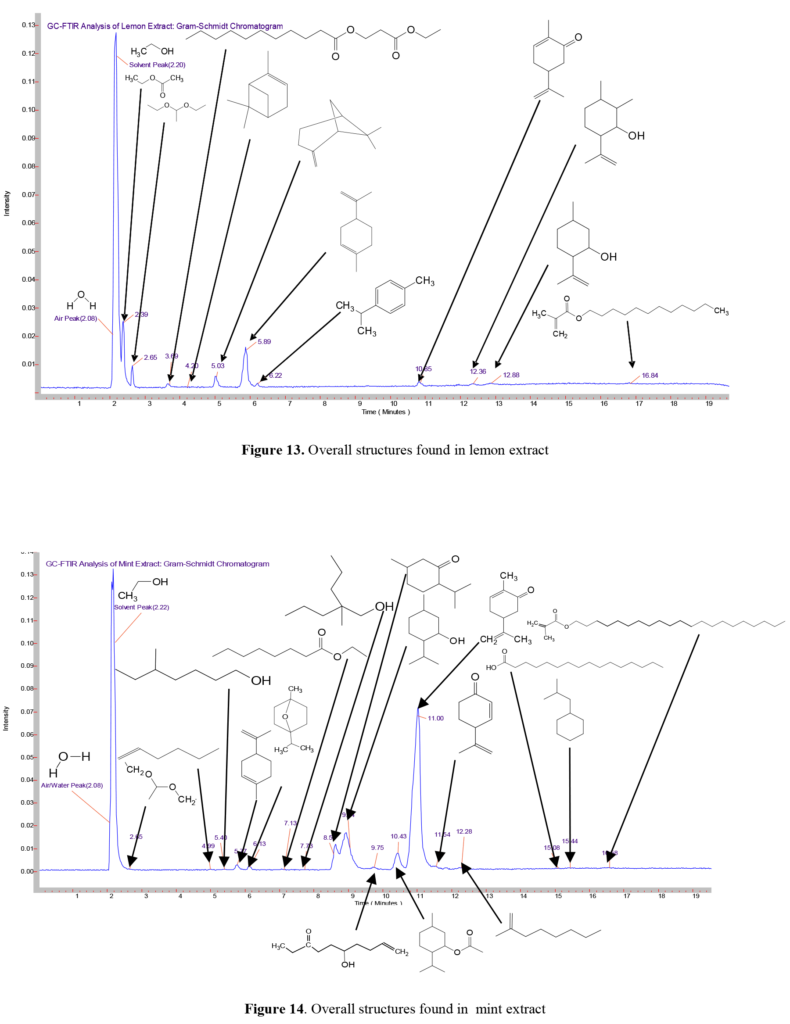
| Mint Components | Lemon Components | Common Components |
|---|---|---|
| 1-Hexene | Ethyl Acetate | Water |
| 5-Methyl-1-hepanol | Diethyl adipate | Ethanol |
| Eucalyptol | α-Pinene | Diethyl acetal acetaldehyde |
| Ethyl-5-methyldecanoate | β-Pinene | Limonene |
| 2-Methyl-2-propyl-1-pentanol | 1-Isopropyl-4-methylbenzene | Carbone |
| Menthone | 2-Isopropenyl-5,6-dimethylcyclohexanol | Dodecyl methacrylate |
| Menthol | Isopulegol | |
| 1-Decen-5-ol-8-one | ||
| Menthyl acetate | ||
| 4-isopentyl-1-octene | ||
| Hexandecanoic acid | ||
| Isobutylcyclohexane |