Analysis of Complex Organic Materials
Identifying the components of a candle and determining whether or not compositional claims are accurate can be a challenge. Many analytical tools could be used, but in this case study we focus on infrared spectroscopy and our knowledge of the chemistry of waxes and scents. It describes the tools used to characterize modern candles and the differences in the products.
What is in Those Candles?
Summary
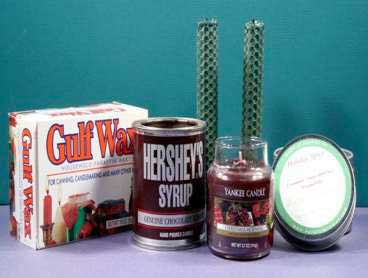
Candles were at one time a necessity. Now they are a luxury used to enhance our homes. Originally they were very simple in design and used to light the night but now function to provide scent and decorative elements.
Identifying the components and figuring out if they are what they claim can be a challenge. Many analytical tools could be used but we are going to focus on infrared spectroscopy and knowledge of the chemistry of waxes and scents.
Background
Candles have long since been replaced by electric lights but remain popular as a decorative element. Scented candles are popular and bring fresh, new scents to the consumer.
In the most basic form, a candle consists of a fibrous wick surrounded by solid fuel source. The solid fuel has a melting point low enough so that the flame at the top of the wick will melt the fuel. The fuel rises through the wick and when reaching the higher temperatures of the flame core, the liquid fuel vaporizes and supports the flame.
Candles were originally made from tallow, a byproduct of farm animal slaughtering. Paraffin wax, chemically the simplest solid fuel for candles, replaced tallow during the Industrial Revolution. Paraffin wax is a mixture of aliphatic or saturated hydrocarbons recovered from crude oil by distillation. They have a higher boiling point than gasoline and diesel but lower than asphalt.
Science
Spectroscopy is defined as the study of the interaction of light with matter. Light is defined as not just the area of the spectrum that we can see but also shorter and longer wavelengths. Infrared are those wavelengths that are longer than we can see and we sense them as heat. When that heat energy is passed through a sample, some of it is absorbed. The absorption depends on the chemical makeup of the sample; some bonds between elements in a material will absorb one wavelength while other bonds will absorb different wavelengths. The absorption wavelengths are unique to the material of interest and provide a “fingerprint” of the sample. So, infrared spectroscopy can answer “what is it?”
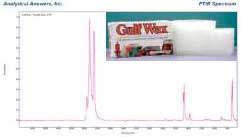
The infrared spectrum of paraffin wax is simple, showing only the absorbance of saturated C-H stretches and CH2 bends.
In paraffin, there are two strong CH2 bands between 3000 and 2800 cm-1, and the much weaker CH3 stretch bands. The relative sharpness of the bands as well as the band splitting indicates a narrow range of molecular weights or chain lengths.
Natural Beeswax Candle
The first actual candle is labeled as ‘hand rolled natural beeswax’. Beeswax is a white to light tan color, not green and the hexagonal pattern seems to be pressed into a flat sheet not from a deep matrix of comb cells. Unlike paraffin wax, beeswax consists of 75% long-chain fatty acid esters, with a melting point of ~60°C. It is not a pure material but is a mixture of similar compounds. The balance consists of compounds such as free fatty acids and aliphatic hydrocarbons (paraffin) typically present at less than 10–15%. Comparing the spectrum of the ‘natural beeswax candle’ to the paraffin we see lots of interesting features. The spectrum looks very similar to paraffin with all the features indicating a narrow molecular weight and a crystalline material.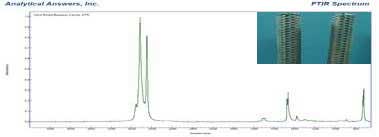
That is inconsistent with a natural product. There are also see a few weaker additional bands that are consistent with the chemistry of beeswax. Checking AAI’s reference libraries we can compare the spectrum of this material to both natural beeswax and to parraffins. Natural beeswax has a significant absorbance at 1740 cm-1 that is typically about half the intensity of the CH2 stretch bands. Since this candle does not show that ratio of bands, there is probably very little beeswax present. Based on the infrared spectrum of this candle, we can conclude the candle is mostly paraffin with a small amount of beeswax.
Hershey’s Syrup Chocolate Candle
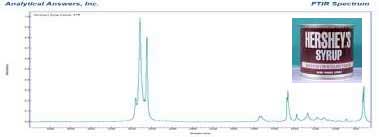
The first candle was unscented; our next candle has a distinct chocolate scent when lit. Again, the same bands are present that we see in paraffin. The weaker features in the fingerprint region (~1800 – 800 cm-1 called that because each compound has a unique signature) of the spectrum, show a richer collection of peaks than simple paraffin wax. There are peaks typical of esters and ketones as well as other functional groups.
In the beeswax candle, we expected to find higher molecular weight waxy esters produced by bees. What we found was a mixture of higher molecular weight paraffin waxes and waxy organic acids. These compounds are not very volatile and have little noticeable odor.
Lower molecular weight organic compounds are more volatile, and have a wide range of odors, from pleasant to unpleasant. The spectrum of the ‘Hershey’s Syrup’ candle indicates the presence of esters and ketones that usually have a fruity to pungent odors. Along with ethers, alcohols and acids, these compounds are responsible for much of the fragrances of plants, fruits and flowers.
To identifying all the volatile compounds found in the “Hershey’s Syrup” candle (labeled “contains 8% cocoa oil”) you would needs a sophisticated separation because many different volatile compounds contribute to unique scents. But based on the spectrum and our knowledge of scent chemistry we can deduce that there are scent compounds present in the paraffin wax matrix.
Yankee Candle Christmas Morning
The Yankee Candle Company of South Deerfield, MA, (according to their press releases) “…is the leading designer,manufacturer, wholesaler and retailer of premium scented candles, based on sales, in the giftware industry.” Yankee Candle sells a wide variety of candles, with a wide range of popular and seasonal scents.
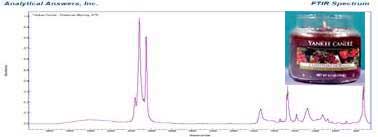
As in previous candles, the infrared show the sharp and crystalline features typical of a paraffin wax. But there are also indications of an alcohol and a strong carbonyl at 1740 cm-1 as well as stronger bands in the fingerprint region than we saw in the previous candles.
All these indicate a variety of scent compounds. Here too we can make some educated guesses as to possible compounds. From the spectrum we find that a number of different aromatic esters, ketones and aldehydes can be matched to the features in complex infrared profile.
Matching individual spectral bands to specific compounds when presented with a complex mixture is not an exact science, as the individual bands from individual compounds may mask, overlap or mimic ‘fingerprint’ band profiles needed for a specific match. For this reason techniques such as FTIR are best at initial compound screening and can be followed up by more compound specific separation techniques such as gas chromatography (GC) or liquid chromatography (LC).
“All Natural” Soy Wax Holiday Spice
The final candle examined here is an “all natural soy wax” candle from Nature’s Aromas. It is labeled “all-natural soy wax complemented with botanical oils, coreless soy wick and cinnamon, nutmeg and clove essential oils.” The infrared spectrum of this candle ‘wax’ shows broader bands and added spectral features compared to the paraffin candles, indicating this is not a simple paraffin wax. Comparison to AAI’s reference libraries indicates a strong similarity to the saturated fatty acid triglyceride ester tristearin.
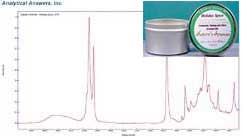
The presence of a saturated fatty acid triglyceride ester in a product labeled ‘soy wax’ is interesting, since soybeans produce very little wax. Soybeans do produce a relatively large amount of natural triglyceride esters in the beans. But the natural triglyceride esters found in soybeans have multiple C=C double bonds called ‘unsaturated’ bonds in the chains. These multiple unsaturated bonds in plant are where the term “polyunsaturated” originated.
At room temperature, these natural compounds are oils rather than solids. To overcome this, a process of hydrogenation is used to add additional hydrogen atoms back into the double bond. So by taking natural soybean oils and subjecting them to hydrogen, heat and pressure we produce ‘natural’ soybean wax. This is the same process that is used to produce solid shortenings from corn or soy oils.
In the infrared spectrum of our ‘natural’ candle we can also see additional bands which are clearly not part of the tristearin profile. The majority of these extra bands fit well to one distinct compound, an aromatic ester identified as cinnamyl butyrate. The major oil which gives cinnamon its’ distinctive aroma is a similar compound, cinnamaldehyde. Commercial fragrance manufactures use similar compounds to those found naturally but usually cost less. At the low concentrations we would need a separation such as GC or LC to say for sure if it is a scent extracted from the plant itself.
Conclusions
As we look at the descriptions of the candles in our story, we can see an interesting progression. We have gone from a pure paraffin product to a product that has a small amount of other components. In the scented candles the infrared spectrum can give us a hint of the types of fragrances. Finally we can also use the technique to confirm that the ‘natural soy’ candle is not exactly as advertised but has probably gone through extensive chemical treatment to allow the components to function as a candle.
This story illustrates that both chemical analysis and knowledge of the materials are necessary as you look at problems and systems in real world samples.