Competitive Product Analysis
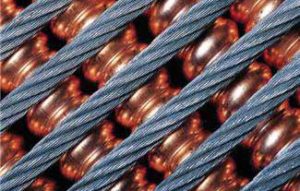
Competitive product analysis is an activity that product engineers face routinely. Two work horses of competitive product analysis are microscopy and spectroscopy. This case study describes pairing the two techniques to best understand a competitor’s product.
Competitive Product Analysis
Summary
Competitive product analysis and failure analysis are two activities that product engineers face routinely. Microscopic techniques are the tools usually relied on when conducting these investigations. Two work horses of this approach are microscopy and spectroscopy. Microscopy techniques provide information on morphology, while spectroscopy techniques provide information on chemistry.
Chemical Information
In the arsenal of microscopic techniques some tools can give both morphology and chemistry. These tools include:
- Electron Spectroscopy for Chemical Analysis (ESCA)
- Scanning Auger Microanalysis (SAM)
- Energy Dispersive X-Ray Spectroscopy (EDS)
- Microscopic Fourier Transform Infrared Spectroscopy (FTIR)
But aside from micro-FTIR (µFTIR), these tools will determine what elements are there but limited information is available on how the elements are put together. Since many high performance materials are now carbon based, determining the chemistries of these materials (actually analyzing the organic content) is exceedingly important to determine causes of failures.
ORGANIC ANALYSIS TOOLS
Analytical Answers, Inc. has a number of tools strictly devoted to determining the composition or properties of organic materials. Each serves a function in the overall scheme of determining “how it failed.”
Fourier Transform Infrared Spectroscopy
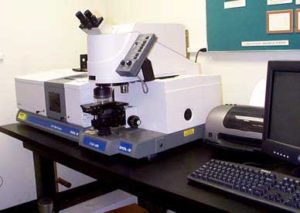
Spectroscopy is defined as the study of the interaction of light with matter. Light is defined as not just the area of the spectrum that we can see but also shorter and longer wavelengths. Infrared are those wavelengths that are longer than we can see and we sense them as heat.
When that heat energy is passed through a sample some of it is absorbed. The absorption depends on the chemical makeup of the sample because some bonds between elements in a material will absorb one wavelength while other bonds will absorb different wavelengths. The absorption wavelengths are unique to the material of interest and provide a “fingerprint” of the sample. So infrared spectroscopy can tell “what it is.”
The amount of light absorbed is proportional to the amount of material that is in the sample. By measuring the amount of light absorbed we can determine how much material is there. This means that infrared spectroscopy can also tell “how much is there.” Using this technique we can determine how organics- and many inorganic materials- are put together, and then can help identify the chemical makeup of the sample.
Thermogravimetric Analysis
Examination of a polymer using µFTIR might tell us that the sample is polyester and there is a carbonate present. Looking at the same sample with EDS tells us that there is calcium present. So we could infer that there is calcium carbonate present. But if so, how much is there?
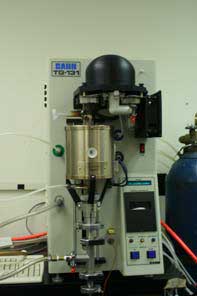
Thermogravimetric analysis monitors mass changes in a sample as a function of temperature and time. The sample is heated with a known temperature ramp and exposed to an inert or an oxidizing atmosphere. The sample will either volatilize away or burn (depending on the atmosphere) leaving the residual material at the final temperature.
In our example above, if the sample is placed in the instrument in an air atmosphere, the polymer will burn away, leaving the calcium carbonate. Since we knew the weight of the initial sample and the weight of the residue, can determine the amount of filler in the polymer.
Other applications of the technique include:
- Determining residual solvents
- Evaluation of flame retardants
- Determining moisture levels
- Isolating and quantifying fillers in a polymer
More advanced studies like studying catalysts and inert or reactive gases can also be done.
Separations
Most organic systems are very complicated. Formulated products might have fillers, slip agents, solvents, and other processing aids. To identify these materials the analysis needs to be able to chemically separate the components n these complex formulated mixtures.
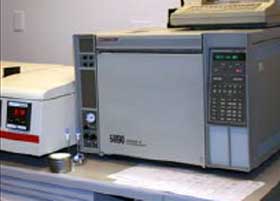
The most two common separation techniques are Gas Chromatography (GC) and Liquid Chromatography (LC). Coupled to a technique that can identify a pure material, such as FTIR, this gives a powerful solution for ripping apart complex mixtures. In Gas Chromatography the sample of interest is injected onto a long fused silica capillary column and the sample is carried along by a flow of an inert gas, typically helium. The sample interacts with a specific coating on the column and is separated based on the polarity of the analyte of interest. More polar compounds “stick” more to a more polar coating and less polar compounds move faster. This is also impacted by the boiling point of the sample; lower boiling compounds move faster than high boilers.
At the end of the column, the eluent goes to a detector. The simplest, detector is a Flame Ionization Detector (FID) and detects organics by burning them. Unfortunately the FID does not give any information about the chemistry of the sample. But the sample can be passed into a specially designed cell before the FID and an FTIR spectrum can be taken on the fly. This then gives a spectrum of the pure compound as it comes off the column. This technique is called GC-FTIR, and separates and identifies the organic components.
In our synthetic polyester example above, we know now that there is a polyester base polymer (identified by FTIR) and a filler, isolated and quantified by TGA. But the sample feels softer than it should and we suspect that there is some plasticizer in the mix. How do we identify it?
By extracting the sample in the appropriate solvent, then using Gas Chromatography, we can separate the components of the extract. Couple the GC to an FTIR, and we can identify what is in the mixture.
Conclusion
Many tools are necessary to characterize organic materials and elucidate how they failed. This study shows an example of using some of the tools Analytical Answers, Inc. has in its extensive arsenal.
Other techniques not mentioned here are also available, and we look forward to applying the tools and our extensive experience in using the tools to the problems posed by our clients.