Introducing Ultra Performance Liquid Chromatography (UPLC)
Summary
Analytical Answers has recently implemented a new chromatographic separation technique known as Ultra Performance Liquid Chromatography (UPLC). This technique complements current chromatographic techniques available at AAI such as GC/FID (Gas Chromatography with Flame Ionization Detection), GC/FTIR (Gas Chromatography with Fourier Transform Infrared Spectroscopy), and GC/MS (Gas Chromatography with Mass Spectroscopy). Areas where UPLC can be applied to provide information which cannot be obtained by any of the gas-phase chromatographic techniques will be described.
What is UPLC?
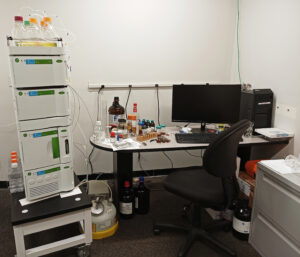
Ultra Performance Liquid Chromatography (Figure 1) represents the latest advancement in liquid chromatographic separation, characterization, and quantitation. While nearly everyone has heard of Gas Chromatography (GC), typically in conjunction with Mass Spectroscopy (MS), liquid chromatography represents a complementary separation and characterization technique for compounds and solvents which cannot be vaporized for GC analysis. However, the two techniques do share some similarities.
Both GC and UPLC work with very small sample volumes, typically on the order of 1 – 10 µL. Both use microvolume syringes to inject a small volume of the sample into the system, sometimes with additional ‘splitting’ (dumping a measured fraction of the sample out the GC waste port) or dilution (with the UPLC mobile phase). The sample then flows onto the separation column. For GC, the column is a very small diameter (ca. 30 µm) open tubular column with the a thin (~2 µm or less) cross-linked organic compound which selectively absorbs individual components of the sample matrix. For UPLC, the column is based on a dense packing of fine (~2 µm or less) inert inorganic, such as silica, with a similar thin cross-linked organic ‘stationary phase’. These silica particles are themselves covered in fine pores, typically measured in the nm (nanometer) size range, increasing the surface area of the stationary phase to interact with the components of the sample mixture. Both GC and UPLC columns come in a wide range of different sizes, diameters, particle size, stationary phase chemistry, lengths, sample capacities, and other variables, allowing selection of column specifics to meet specific analytical needs.
In GC separations, the temperature of the column is gradually ramped under a constant flow of the gas mobile phase (typically helium). Increasing temperature reduces interactions between heavier or more strongly absorbing compounds with the stationary phase, and speeds the analysis. In LC separations, the temperature of the column is held constant, and the composition and characteristics of the liquid mobile phase is changed. AAI’s UPLC system is equipped with a quaternary pumping system, allowing four different solvents to be blended in simple to complex gradients. This permits varying ionic strength, pH, hydrophilic / hydrophobic character, and others, again modifying interactions between different analyte molecules and the stationary phase to increase the efficiency and speed of the separation.
After passing through the column, the now separated individual components of the mixture then flow into the detector(s) modules. For GC, these have been optimized for gas-phase detection, through flame ionization (FID), or infrared absorption (FTIR) or mass spectral fragmentation (MS) characterization. For LC, these are optimized for liquid-phase detection, and include techniques such as refractive index (RI) changes, or UV-Vis absorption using a PhotoDiode Array spectrometer (PDA). Like the different detectors for GC applications, individual LC detectors are used depending on the nature of the matrix, analyte, and objectives of the analysis.
Evaluation of Sugars in Carbonated Beverages
As an example of where UPLC analysis can provide information on materials which would be difficult by other techniques, we examined two different carbonated ‘root beer’ beverages. For the non-diet formulations, such beverages are based on a heavily sweetened ‘syrup’. High fructose corn syrup (HFCS) is commonly used in such beverages due to cost, ease of handling, consistency, and other factors. However, there is a significant consumer demand for carbonated beverages sweetened with cane or similar sugars based on sucrose, due to individual taste, health concerns over HFCS, and other factors.
Aqueous-based mixtures present a challenge for gas-chromatographic techniques, as a water solution typically cannot be directly injected into a gas chromatograph, nor are aqueous solutions compatible with high-vacuum mass spectrometers or infrared gas transmission cell component. Likewise, water-soluble compounds, such as sugars, starches, proteins, and other macromolecules do not volatilize in high-temperature GC injection ports, but instead decompose to form a solid ‘char’ blocking flow to the GC column.
For aqueous mixtures, especially those containing larger, nonvolatile or temperature-sensitive compounds such as dyes, surfactants, chelates, and others, UPLC offers the ability to separate, characterize, and measure the amount of such compounds without the need to perform initial extractions, derivations (chemically reacting the analyte with another compound to form a volatile product), or other sample/matrix pre-processing.
AAI’s UPLC system was configured with a column optimized for the separation of low molecular weight organic acids, sugars, water soluble carbohydrates, and similar compounds. Figure 2 presents two chromatograms using the Refractive Index (RI) detector of aqueous reference solutions of ~10% sucrose or ‘cane sugar’ (green) and fructose (red).
Here, we see the sucrose elutes from the column just after 4 minutes, while the fructose, with a greater degree of interaction with the stationary phase, elutes at almost six minutes. Two different root beer sodas were acquired from the local supermarket, one listed as containing HFCS and the other advertised as using cane sugar. Other than pouring small volumes out of each, allowing each to go ‘flat’ (gas bubbles will interfere with UPLC sampling), the two were injected and produced the chromatograms as presented in Figure 3.
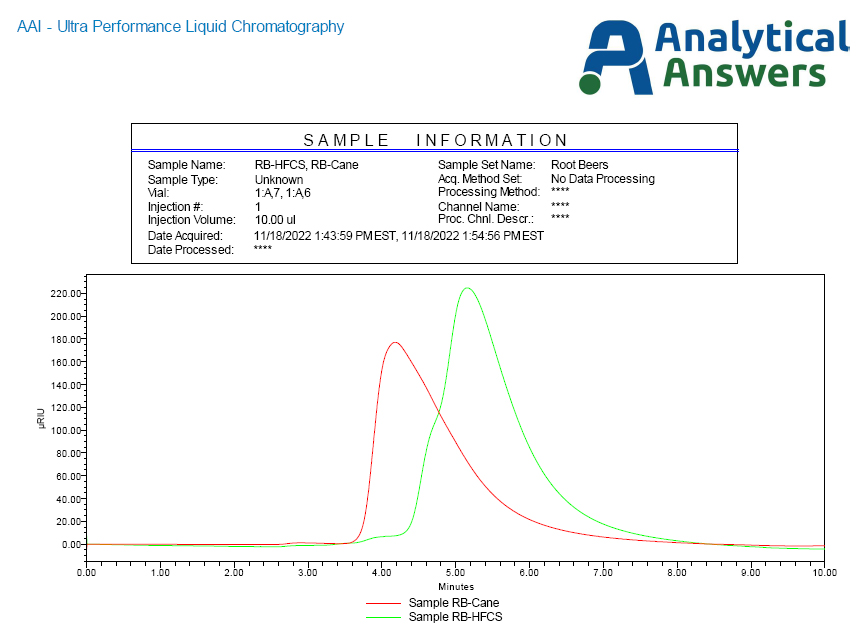
While the cane sugar-based root beer generated a profile consistent with sucrose, the HFSC root beer profile shows a ‘shoulder’ on the leading edge of the fructose peak, indicating additional compounds than fructose. In addition to the RI detector, AAI’s UPLC system’s UV-Vis PDA (PhotoDiode Array) detector can provide additional information on these systems.
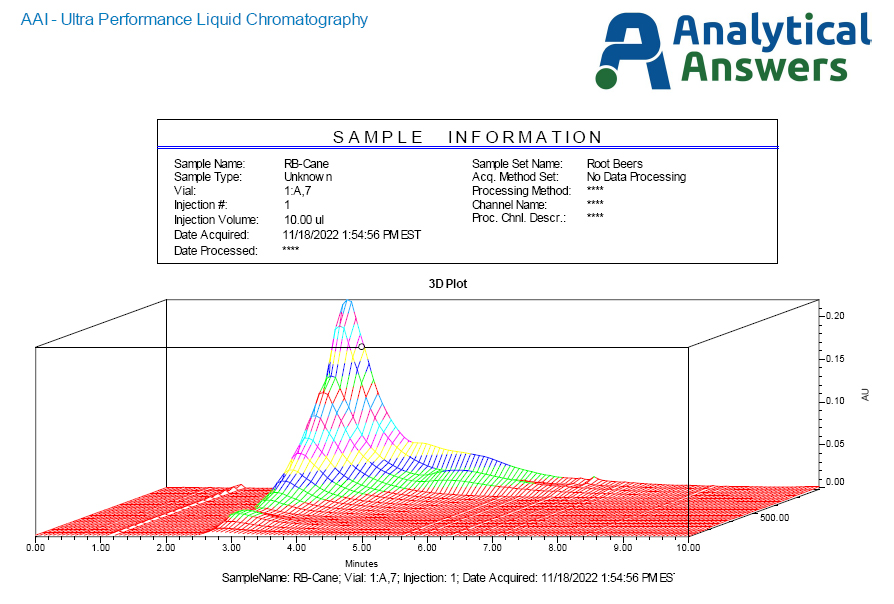
Figure 4 presents the PDA ‘hypercube’ chromatographic profile of the cane sugar-based root beer. In this plot, increasing elution time is presented along the front axis, wavelength increasing from back to front on the side axis, and absorbance intensity increasing from bottom to top. For the cane sugar root beer, this data shows a major peak with strong UV absorbance just before four minutes, consistent with the sucrose. However, a broader ‘tail’ is seen, most likely due to the caramel coloring component.
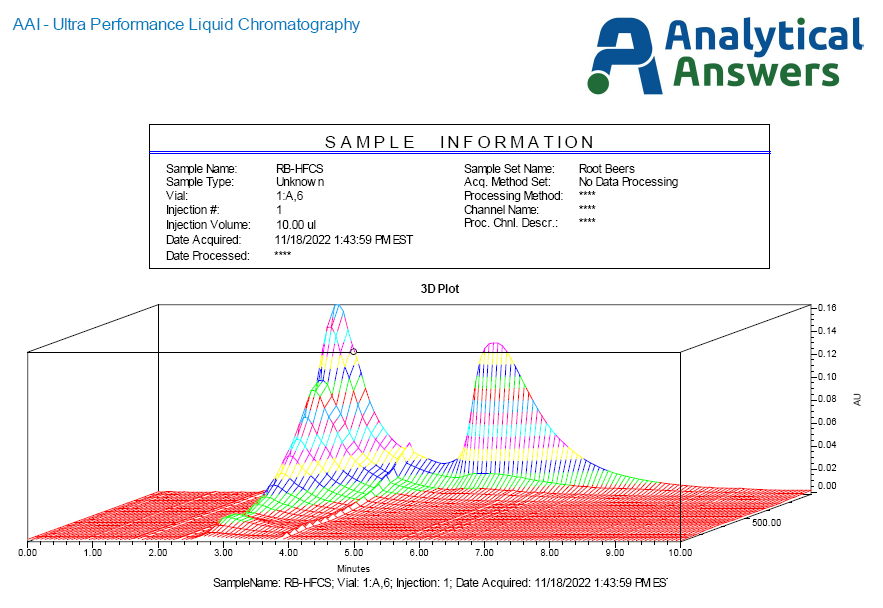
Figure 5 presents the PDA profile of the HFCS based root beer. Here, the strong UV absorption of the fructose is seen just before 6 minutes, but interestingly, a strongly UV absorbing response is also seen around the same time as the sucrose. This is consistent with the caramel coloring, which is based on partially oxidized sucrose and similar sugars.
Conclusion
With the acquisition and implementation of UPLC technology, Analytical Answers is now able to offer additional chromatographic separation and characterization of systems not amenable to GC/MS, GC/FTIR, or GC/FID analysis. These systems could include water soluble organics, such as organic acids, detergents, surfactants, biological macromolecules, temperature-sensitive organics such as amines, antioxidants, dyes, nonvolatile compounds such as some plasticizers, polymer additives, oils, lipids, and others. We look forward to discussing how we might best provide you with the information you need through UPLC analysis.