Infrared Imaging
Fourier Transform Infrared Imaging is a technique that that provides new insight into the chemical composition of a wide variety of materials.
FTIR Imaging– What is it and how can you use it?
Summary
FTIR Chemical Imaging provides wavelength-specific, high resolution infrared images and the underlying spectral data used to determine chemical differences in a sample. Using this technique, chemical changes that could not be visualized previously are highlighted in the sample, providing a much richer data set to solve problems involving polymers, electronics, biological and material sciences. This case study illustrates the uses in a number of industries.
Introduction
The term imaging has various meanings depending on the audience. The dictionary definition of Imaging is To make or produce a likeness of an object. The physics definition is The science of producing, recording, storing, transmitting and/or displaying visual images by any system (photographic, video, facsimile, etc.) in any form. A quick search on the World Wide Web brings up topics such as film and digital photography, visible, atomic force and electron microscopy, cytology, radar, computer security, magnetic resonance imaging and positron emission tomography.
The term imaging has a different meaning in each field. And as an investigation of the terms will show the implementation of each “imaging technique” is quite different.
Infrared Images
The acquisition of infrared pictures is also a form of imaging. These images can be taken using film or a CCD sensitive to short wavelength infrared (~1 micron). There is no wavelength specificity here and the picture is the overall response from all the wavelengths of light hitting the film or CCD chip.
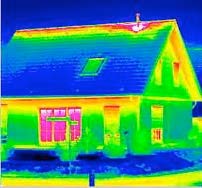
This is the type of thermal image that is taken to determine heat leakage from a home during an energy audit.
Spectrochemical Imaging
The most effective way to acquire a wavelength specific image of a sample is to take a picture using an infrared sensitive camera and an FTIR. Here the user will obtain a 2 dimensional image at all wavelengths in a single measurement. This is accomplished by combining the technologies of a Focal Plane Array, (FPA) and the FTIR. A focal plan array is a two-dimensional array of infrared sensitive detectors similar to a CCD, and measures a signal at every point from the sample area examined. The FTIR produces simultaneous spectral information at every frequency. The result is a spectrum at every point on the sample, collected simultaneously.
The sample is imaged on the whole array, and so each detector pixel collects the spectrum from one element of the “grid.” Effectively a full array of spectra is collected in a single scan. The results are:
- High resolution images impossible by normal FTIR
- Fast Data collection.
- High Spatial Resolution (~5microns)
- High Signal-to-Noise Full-Spectral Information from every pixel
- An analysis time of 10s of seconds to minutes.
The key is efficiency and time to acquire the data. In the single detector experiment, when samples smaller than the detector element size, performance is poor because the signal arises from only a small part of the detector but the noise results from the entire detector. An aperture is typically used to mask the sample to the area of interest. To achieve the same signal to noise across the sample one would theoretically need to collect data for fifteen minutes at each point when compared to square arrays for which no aperture is required. A comparison of the time it takes to acquire equivalent data on the same size sample is shown below.
| Technique | Detector Size | Spatial Resolution | Total Data Collection Time |
|---|---|---|---|
| Mapping | 250 Microns | 10 Microns | 64 Hours |
| True Imaging | 5.5 Microns | 5.5 Microns | 1 minute |
The following example illustrates this advantage. The sample here is a beverage can. On the front surface there are a variety of coatings. The visible picture shows the area where the spectrum was taken with approximately 15 seconds in data collect time.
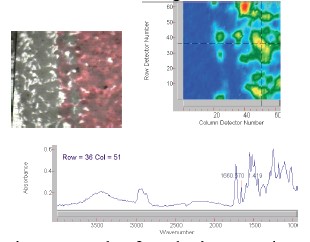
Below is the imaging technique. Here the spatial resolution is achieved by each pixel in the array so the aperture is not used. On the left is the visible image of the sample showing black, red and clear paint. The infrared image, constructed at 1660 cm-1 is indicative of the chemistry of the red paint. In this false color image red indicates more material at that wavelength and blue indicates none.
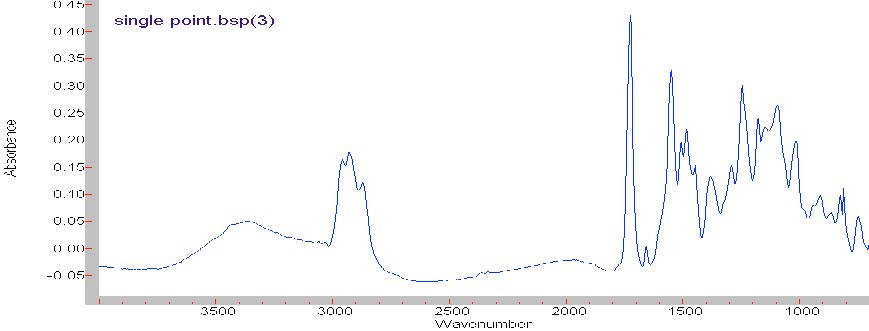
A spectrum taken from the data set at the location of the cross hairs is also shown. This represents a 5.5 micron area on the sample. Each spectrum has a similar signal to noise ratio as this one and the entire data set represents 4096 spectra acquired in approximately 30 seconds!
Electronics
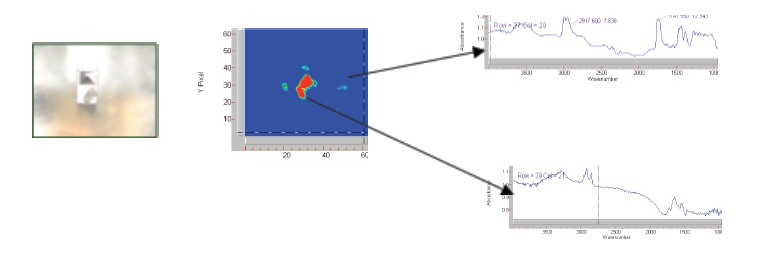
A practical example of the technique is identification of a contaminant on a metal contact. The sample shown in the visible light image on the left is a pointed contact, resting on a gold arm with a piece of contaminant on it. The sample was examined in reflection mode, and the contamination shows up as a red spot or high concentration, on a blue field. From the spectrum we can identify that the sample is probably an ester type material. What is most interesting to note here though, are the other light spots on the blue background. This indicates other areas of organic contamination not visible in the optical image. The spectrum of one of the other areas indicates a protein material, probably a skin flake.
Conclusion
True imaging in the infrared, giving a high resolution “snapshot” of the sample with a full infrared spectrum underlying each pixel permits the acquisition of high resolution spectral and spatial resolution data with extraordinary signal to noise can in a very short time. The approach can be used with all the common sampling techniques such as transmission, reflection absorption and Attenuated Total Reflection (ATR). It lends itself to a variety of applications including electronics, material science, food materials, pharmaceuticals, biological materials, and more.